COVID-19Different testsJohn Jacobs
|
Detecting viruses and virus infections is crucial to virology. Different tests show different microbiological aspects, some will detect the virus, other the infection or the disease. Many tests have been developed for clinical testing. Epidemiology focuses on different aspects.
Detecing virus
Direct testing will detect the virus or viral units. These tests have the advantage that they directly show the current presence and could quantify the amount of virus.
Culturing infectious virus
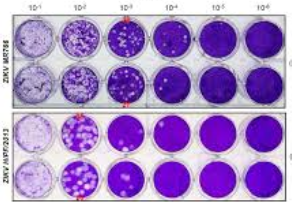
Virus culture is the classic gold standard by detecting infectious virus. By using a dilution range of the number of plaque forming units the amount of infectious virus can be quantified (Figure 1). The major disadvantages are that it is labour intensive to perform this test and it requires a BSL-3 lab. This is a higher safety level that the more common BSL-2 lab.
Figure 1. Dilution series of a virus plaque titration. The white areas indicate cell lysis due to the virus. The numbers above correspond with the dilution. Two different samples are shown in duplicate.
RT-qPCR to detect virus RNA
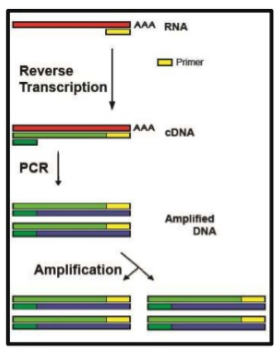
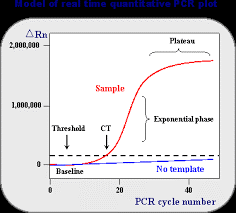
Commonly the RT-qPCR is used as the new gold standard to detect virus RNA (Figure 2). RNA is chemical and biological instable, so when the infectious virus has disappeared, the RNA will be disappeared.** It is the most sensitive test, because the majority of particles is not infectious. Technically this test has a few steps: (i) RNA isolation, (ii) reverse transcription (RT) of RNA to cDNA, (iii) DNA amplification using PCR. (iv) real—time detection of the amplification product allows a quantification (q) of the result (RT-qPCR). This test requires about 3 hours. Many other molecular biological tests are similar, but often a little bit faster, e.g. 1.5 hours.
Figure 2. Left RT-PCR of viral RNA, with additionally quantification by Cycle threshold (Ct) number. In each cycle the cDNA is amplified, thus a higher Ct indicates that less viral RNA was present in the sample.
Sandwich ELISA for virus antigen
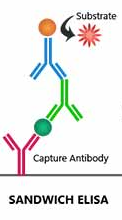
Viral proteins can be detected either with antibodies or molecular identification. The sandwich ELISA for virus proteins uses reaction wells coated with antibodies against SARS-2. The sample is pipetted in these wells and washed out after incubation. Subsequently, a second and often a third antibody are used to detect the virus (Figure 3). The number of steps in this assay makes it time consuming. Biosensors with antibodies could do this much faster (Qiu), but these apparats are quite expensive.
Figure 3. Sandwich ELISA. Antibody-coated reaction vessels are incubated with a virus-containing sample. After washing out non-binding proteins, other anti-virus antibodies are added to detect the bound virus.
Massa spectrometry on virus proteins
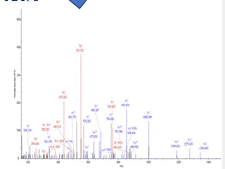
For mass spectrometry of virus proteins, the proteins are chopped by acid and/or enzymes (Nikolaev). The remaining protein fragments are detected and further characterized at the amino acid level, adding specificity to the test (Figure 4). Virus fragmentation steps could be significantly reduced in time, allow to complete the test in ½ to 1 hour. A major disadvantage is that mass spectrometry requires advanced and costly machines.
Figure 4. Mass spectrometry. Peaks correspond with specific molecular sizes that can be split into amino acids to identify virus proteins.
Sampling
Sampling is crucial for all tests that detect the virus directly. Normally, samples are taken in the nasopharyngeal and/or oral cavity (throat). However the virus does not remain at these location (NYTimes), but migrates to the lungs and later to the blood circulation (Jacobs, see also). If the virus has left the nasopharyngeal and/or oral cavity someone could still have a pneumonia and/or systemic infection, but the virus cannot be shown in those cavities.
Antigen-specific immunity
Detecting antivirus immune responses
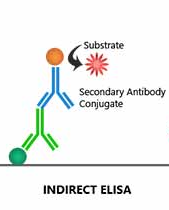
A complete different strategy is to detect antiviral immune responses. Antibodies and antigen-specific T lymphocytes could indicate a recent or a current infection. Detecting antigen-specific T lymphocytes is highly specialized and complex. Antibodies can be easily shown using an indirect ELISA. The well is coated with viral proteins to capture the antibodies. Using anti-antibody antibodies, the type of immunoglobulins can be shown (IgM, IgG). Similar to a sandwich ELIS could this principle also be used in a biosensor.
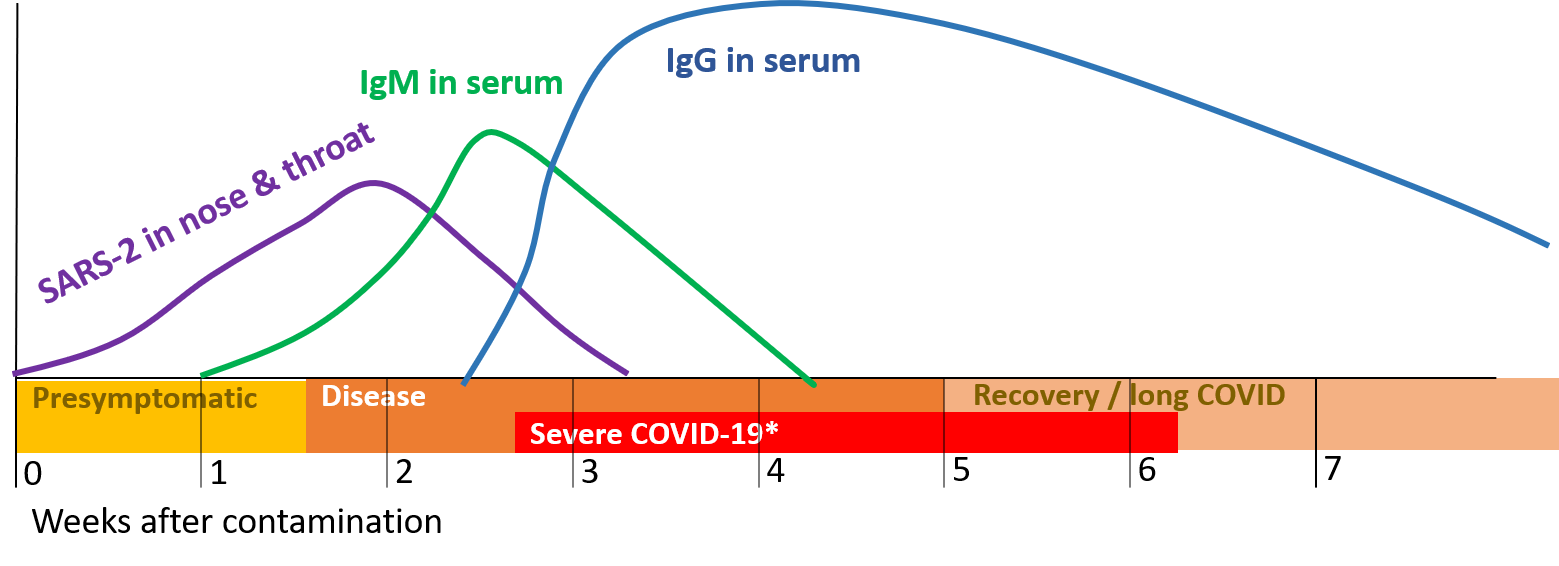
Figure 5. Timing of infection, disease and antibodies (IgM en IgG) against SARS-2. The disease starts presymptomatic after which some will develop symptoms when immunoglobulins (antibodies) are produced. Some may develop severe COVID-19 later on. The Recovery period can be long COVID for a minority (10-20%) of patient over 3 to 6 months..
Antibodies
Antibodies do not show the infection directly, but only inform on the antivirus immune responses. Vaccine could induce antibody responses without infection. The most important antibodies are immunoglobulin M (IgM) and IgG. IgM is made early in the infection, but later replaced by IgG, which is more specific. Using antibodies against these antibodies, it can be shown which antibodies were in the sample. An ELISA takes several hours, but a biosensor test could speed up this process..
Figure 6. Indirect ELISA. Tubes are coated with virus. Antibodies in the sample can bind to this. Then those antibodies are detected with anti-antibody antibodies.
Cross-reacting immunity
SARS-2 belongs to the coronaviruses, which also includes some common cold viruses with similar proteins for internal virus processes. In spite of high specificity, some antibodies might cross react. The ELISA could be developed to either ignore or detect these antibodies cross-reactive against conserved proteins, depending on the scientific aim.
Disease-related symptoms
Evaluating symptoms
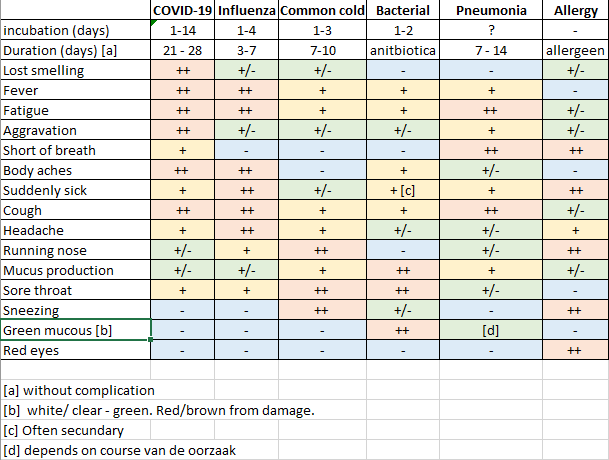
With exception of the virus culture all techniques were newly developed during the last 50 years. In the past when detecting viruses we very hard, detection was limited to symptoms of diseases persons. I wrote in TTI that detection based on symptoms is not an optimal anti epidemic approach. People with symptoms have many flu-like complaints (Figure 7). The most specific complaint is loss of the smelling ability. If someone specifically loses his smell, without extreme mucous production, the diagnose of COVID-19 seems warranted. It should be noted that not everyone with an infection has symptoms. Asymptomatic and generic complaints are the reasons why many COVID-19 cases are undetected. The virus can continue spreading when infections remain undetected.
Figure 7. Symptoms of some respiratory infections
Strategies and aims
Clinical versus epidemic testing
The most important aspect of hospital diagnostic is confirmation of disease and a complete medical background. TTI testing aims at fast detection of infected people to quarantine these (Mina). An intelligent approach uses source and contact tracing, to minimize false positives. This is not applicable for diagnostic tests. Diagnostic tests for SARS-2 require (a) more time, (b) more specialized workers and/or (c) more specialized apparats than a large scale TTI test. A pre-screening using a rapid test could identify people who need to be tested.
Tiered approaches
Rapid tests
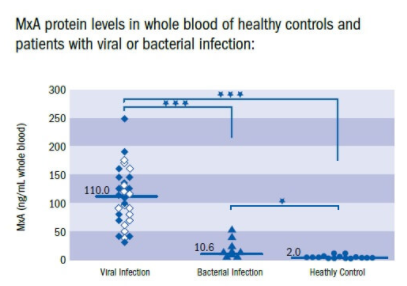
Population testing requires a lot of time, while most people could eliminated for testing by a rapid test. Rapid tests determine if someone has an infection, but not specifically for SARS-2. A second test would be needed to confirm if someone suffers from a virus infection. This could be a common cold or influenza, but also COVID-19. Rapid detection should be able to verify this in 10 minutes (Shirley). The test shows the protein Myxovirus resistance A (MxA) which is induced by type I interferon only that is typical for virus infection. People who are positive for a virus infection, could be tested for SARS-2. This would imply a vast reduction in the needed number of tests and improve the speed and efficacy of testing.
Figure 8. MxA test to detect virus infectio
Confirmation of SARS-2 infection
Rapid screening on virus and bacterial infection could be used as an additional safeguard for crowd gatherings, like football matches, concerts, shows and popular festivals. May a rapid test could be performed daily at home (nytimes) with similar ease than a pregnancy test.
After a rapid test confirming virus infection, an additional test is needed to discriminate SARS-2 from influenza or common cold viruses.
After a rapid test confirming virus infection, an additional test is needed to discriminate SARS-2 from influenza or common cold viruses.
False-positive and false-negative results *
No test is perfect. Each test misses some infections (false negative) and has unjustified hits (false positive). The impact of this error depends in practice on the quality of the test, the incidence of the infection in the population and the testing strategy.
Specificity and sensitivity show the quality of a test . Specificity is 1 minus the probability of a false positive result. So if an uninfected person has a probability of 1% for a positive result the specificity equals 100%-1% = 99%.
Sensitivity shows the fraction of infections that is truly detected. A sensitivity of 95% tells that 95% of all infections are detected.
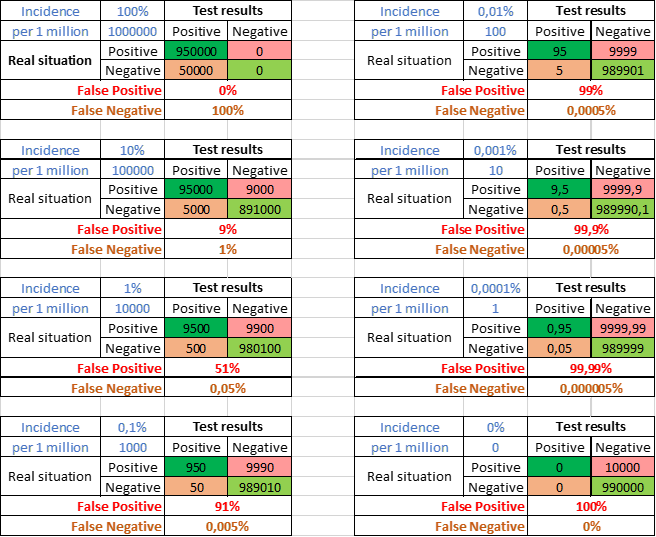
Incidence is the number of infected people in the population. Figure 9 shows a test with 99% specificity and 95% sensitivity. Only infected people could obtain false negative results, only uninfected false positive. The incidence of virus infections is generally low. 1 per 1000 (0,1%) bottom left is quite high. In this example 91% of the positives would be false positives. With a 10-fold lower incidence (upper right) even 99% false positives.
Figure 9. Effect van incidence on percentage false positive and false negative results. Example with 99% specificity, 95% sensitivity and various (in blue shown as % or number per million).
Combine tests for more reliable results.
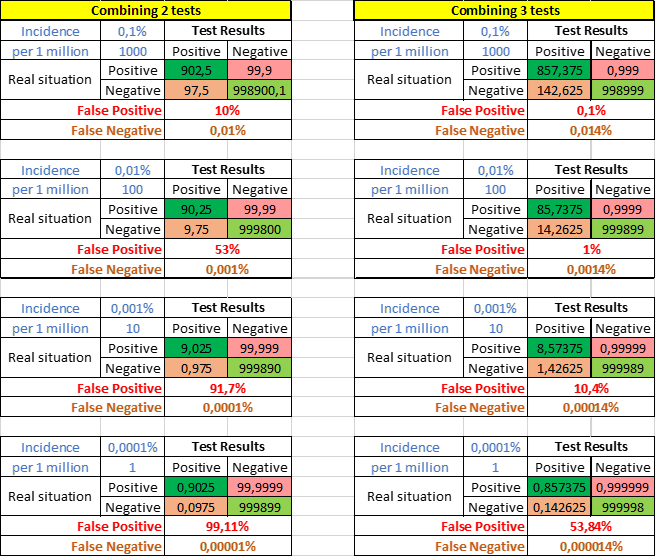
Virus infections often have a very low incidence resulting in a high percentage of false positives. This can be minimized by combining multiple lab assays, like RT-PCR for different genes. When two tests with each a specificity of 99% are combined and both should be positive, the new specificity becomes 99.99%. This would lower sensitivity to 90%. The percentages of false positive results will decrease strongly (Figure 10). Combining 3 tests will be even stronger 99.9999% specificity and 86% sensitivity. Almost all diagnostic RT-PCR in labs consist of 2 or 3 different assays.
Figure 10. False-positive and false negative results when two or three tests with each 99% specificity and 95% sensitivity are combined.
John Jacobs
12 - 09 - 2020
* section updated 26-09-2020. ** Sentence added 13-10-2020
12 - 09 - 2020
* section updated 26-09-2020. ** Sentence added 13-10-2020


