COVID-19
|

|
Oversterfte in Europa - Supplement excess mortality
7. Methodology
Data of excess mortality per month was collected from the EEA database. These data were quite complete, only for Italy and Sweden the data of the last month of 2022 were missing. The epidemic seemed to swipe from one country in Europe to another, suggesting that monthly numbers would be strongly alternating between countries. Therefore, yearly averages of excess mortality were estimated by average of monthly estimates. This method is not very exact, months might have some differences in expected mortality rates, and thus weight differently. However, this effect is limited and would not invalidate the method. Regional averages are calculated by correction for population number, ignoring limited differences in standard mortality per country.
I've added an addendum (section 11 + 12) for methodological dicusssion at 26.02.2023
8. Excess mortality North Europe
Adding the distinguishing graph of North Europe including and excluding the Netherlands (Figure 8)
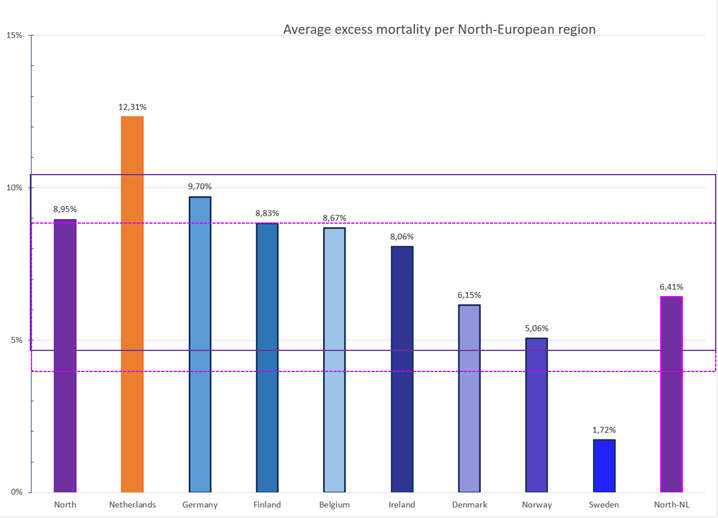
Figure 8. Excess mortality North-European countries. The purple box indicates the SD for all North Europe, the pink dotted box the average without the Netherlands.
9. Vaccine rollout
Vaccine rollout is measured in doses per 100 people, e.g., when everyone received two doses, it would be 200. I will give the values per region; individual countries can be read in the graphs.
Vaccine rollout went smooth in North- and South-Europe. At the end of 2021 quarter 2 (Q2), Q3 and Q4, the vaccine rollout in South-Europe was 82-90, 120-158, and 158-194, respectively (Figure 10). In North-Europe was 80-96, 129-148, and 162-203, respectively (Figure 9). Vaccine rollout in 2021 was slower in most East-European countries, except for Greece, and in Q2 and Q3, also Czechia & Hungary, that could match the numbers of the lowest countries in North and South. At the end of Q2, Q3 and Q4, the vaccine rollout in East-Europe was 26-84, 37-117, and 54-162, respectively (Figure 11).
Data are compared with other regions in the world (Figure 12) and in numbers (Figure 13)
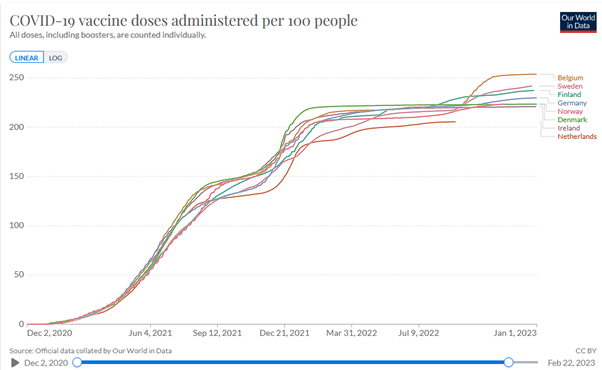
Figure 9. Vaccine rollout North-Europe
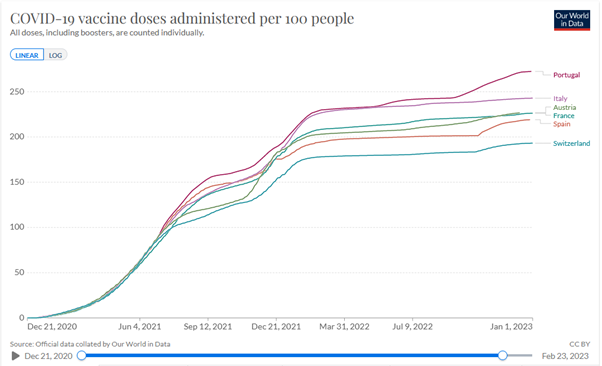
Figure 10. Vaccine rollout South-Europe
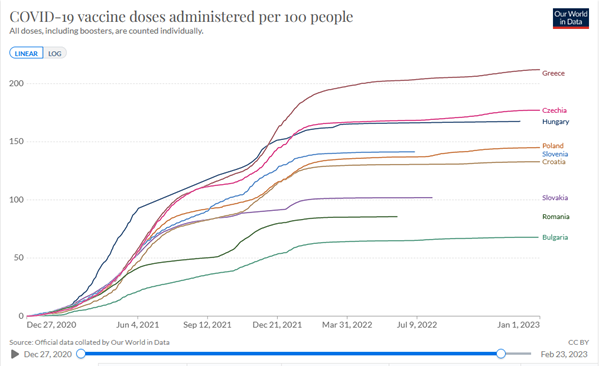
Figure 11. Vaccine rollout East-Europe
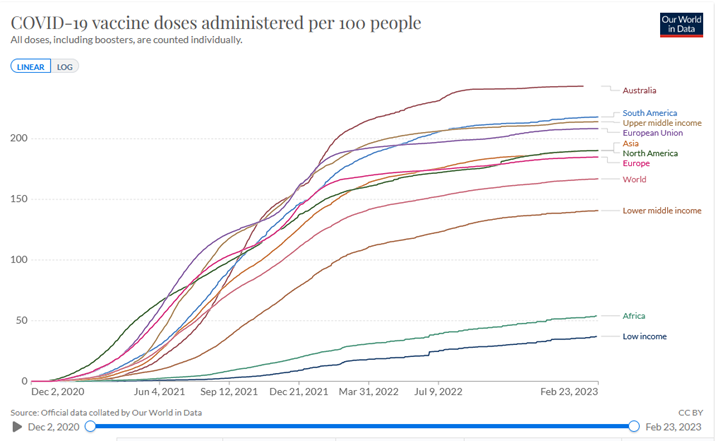
Figure 12. Vaccine rollout for various regions of the world
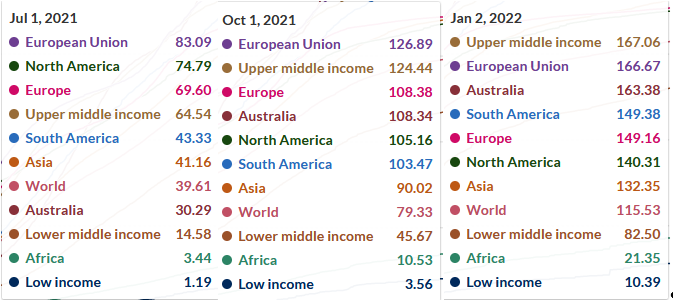
Figure 13. Vaccine rollout numbers for various regions of the world
10. Yearly excess mortality
Yearly excess mortality shown for East-, South- and North-European countries in Figure 14, Figure 15, and Figure 16, respectively.
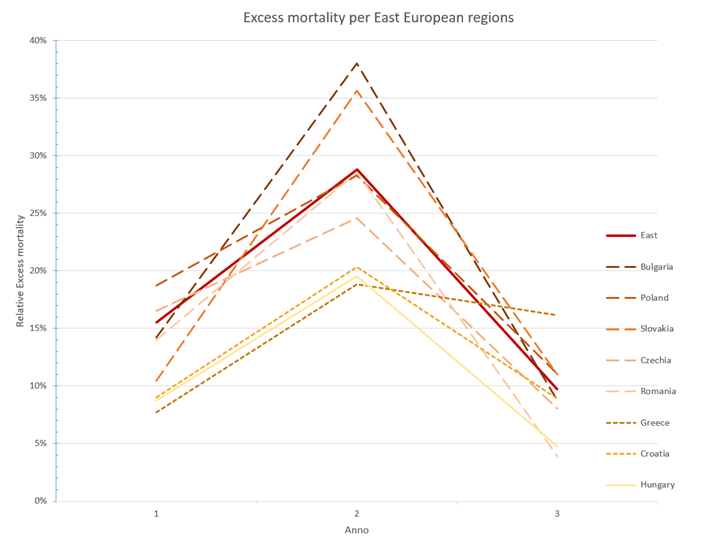
Figure 14. Yearly excess mortality per year in East-Europe.
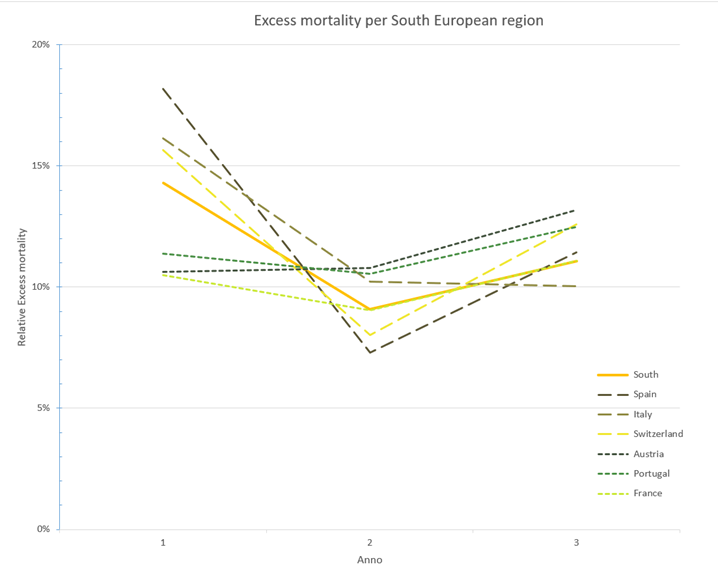
Figure 15. Yearly excess mortality in the South-European region
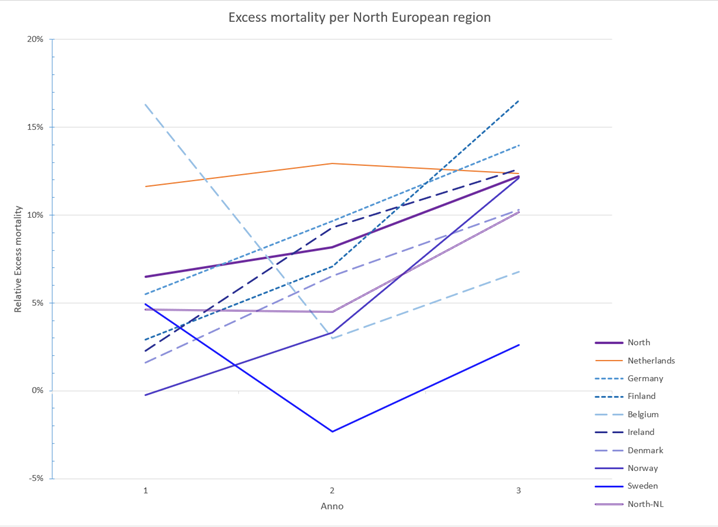
Figure 16. Yearly excess mortality in the North-European region. North-NL is Northen Europe without the Netherlands.
Addendum methodological discussion
11. Covid-related mortality rates?
Covid-related mortality could be calculated as either Covid fatalities or excess mortality, the first one seems purer but the excess mortality is more robust, reliable and usable for comparisons.
Covid fatalities are calculated differently in various countries and even institutes within countries, which has led to inconsistent data comparisons. In the Netherlands, both the RIVM and CBS collect(ed) data on Covid fatalities by different methodologies.
Excess mortality is a more robust method to calculate covid-related mortality, including all causes without overemphasizing.
Covid fatalities are calculated differently in various countries and even institutes within countries, which has led to inconsistent data comparisons. In the Netherlands, both the RIVM and CBS collect(ed) data on Covid fatalities by different methodologies.
- Early in the epidemic, the RIVM defined covid fatality as death within x weeks after a positive Covid test (e.g., x=6 but this differed in time). Sometimes limited to those dying in the hospital.
- The CBS uses cause of death by physicians, in which two types exist: Covid as main cause of death or contributing cause of death.
- Data between RIVM and CBS might differ a factor 2, illustrating the limitations of this method
- Even the higher Covid fatalities from CBS do not add up to the excess mortality observed. This has boosted research into additional causes of death, ignoring that e.g., increased cardiovascular events weeks or months after Covid are not registered as Covid fatalities.
Excess mortality is a more robust method to calculate covid-related mortality, including all causes without overemphasizing.
- It suffers from increased numbers where the epidemic results in care overload, but the consequences of care overload might also be considered indirect covid-related mortality.
- In short term data irregularities occur e.g., due to different epidemics and heat waves, but these are balanced in long-term data.
- Both methods do not take in account increased mortality after Covid e.g., Long-Covid
- Different and incomplete definitions of Covid fatalities make (inter)national comparison of data very difficult.
- The WHO uses Excess mortality to calculate the true cost of the epidemic.
- The Economist showed that the death toll of the covid epidemic is much higher than previously calculated (Figure 17)
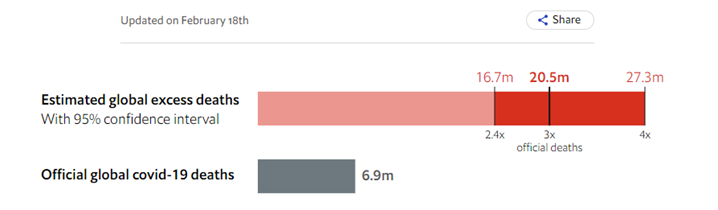
Figure 17. Excess mortality from Our World in Data
12 Data normalisation
The most robust calculation of covid-related mortality is using excess mortality during Covid but data normalisation remains essential to facilitate good comparisons. It is evident that absolute numbers of excess mortality will be higher in countries with a larger population but also with an older or less healthy population.
Figure 18 shows a slightly different picture where data is corrected for the population size, but not for the age and healthiness of the population. This implies that countries will a relative old population are likely to have more excess mortalities than countries with a younger population, which is illustrated by the world-wide comparison. Figure 19 shows that countries with a young and healthy population (Algeria, Jordan) tend to score relatively low on excess mortality.
Expected mortality is a robust method to estimate the healthiness of a population. The excess mortality data was collected and normalised as a percentage of the expected mortality. Monthly data were collected from the EEA database as described in section 7.
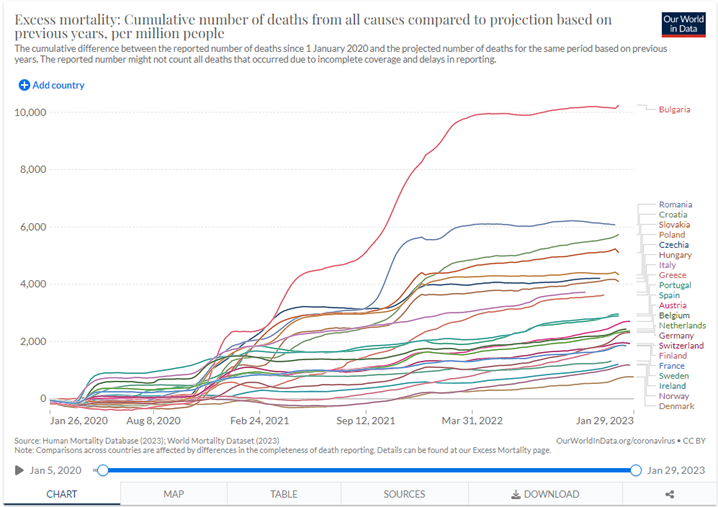
Figure 18. Selected EEA comparison of the impact of Covid on excess mortality from Our World in Data.
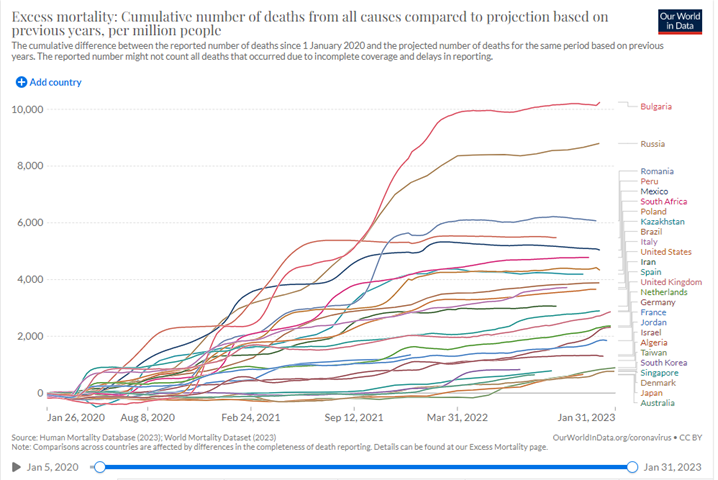
Figure 19. Selected world-wide comparison of the impact of Covid on excess mortality from Our World in Data.
John Jacobs
26.02.20223
26.02.20223